I WISH TO BE CONTACTED

* Mandatory fields.

Email field is invalid

  • Login
  • Demo
  • Contact us
    • Features
    • Fleet Activities
    • Customize your solution
    • Company
  • Company
    • Company
    • Frotcom worldwide
    • About us
    • Become a partner
    • Careers
    • Blog
    • Become a partner
    • Careers
    • Frotcom worldwide
    • Knowledge Center
    • Help Center
English
Menu Menu
  • Login
English
search
    • Blog
    • Become a partner
    • Careers
    • Frotcom worldwide
    • Knowledge Center
    • Help Center
Frotcom Intelligent Fleets Frotcom Intelligent Fleets
Contact us
Try demo
    • Features
    • Fleet Activities
    • Customize your solution
    • Company
    • Vehicle tracking and sensor monitoring
    • Driving behavior analysis
    • Driving times monitoring
    • Workforce management
    • Remote tachograph download
    • Access control
    • Fuel management
    • Route planning and monitoring
    • Automatic driver identification
    • Discover all features
    • How we solve each fleet activity needs
    • Savings calculator
Blog

INRIX Research 2019 Global Traffic Scorecard reveals the world’s most congested cities

Tue, 19/05/2020 - 10:11
News & Events

Traffic data and analytics specialist INRIX Research released it’s 2019 Global Traffic Scorecard, detailing annual rankings of the most congested cities across the world.

INRIX Research 2019 Global Traffic Scorecard reveals the world’s most congested cities
Traffic data and analytics specialist INRIX Research released it’s 2019 Global Traffic Scorecard in March 2020. The Scorecard details annual rankings of the most congested cities across the world and an analysis of congestion and mobility trends for more than 900 cities across 43 countries worldwide and seven continents worldwide.

The Scorecard is the most in-depth congestion and mobility study of its kind, drawing upon three years of mobility data analysis within the world’s most congested cities and valuable mobility insights across transport modes and between cities.

New to the 2019 Scorecard, INRIX Research calculated trip times for both biking and public transport for the same routes from which vehicle delay is calculated. These calculations were used to determine the feasibility of driving alternatives for the most heavily trafficked commuting corridors in each city of study, providing travel time comparisons, and incident congestion impacts. Combined with drive-time maps and last-mile speeds, these advanced metrics provide a unique basis for cross-national commuting comparisons and analysis.
 

Findings

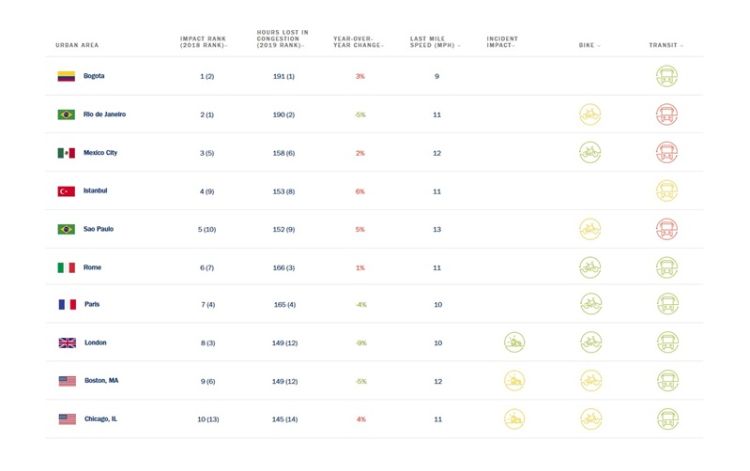
The American continent was shown to account for 11 of the most congested cities in the top 20. When ranking by hours lost in congestion, four of the top-10 cities are located in South America, three in Europe, and two in North America. Bogota (Colombia) was named the most congested city in the world, closely followed by Rio de Janeiro (Brazil), with drivers losing 191 hours and 190 hours, respectively per year in congestion.

In Europe, seven cities featured in the top-20 with Rome topping the chart as the most congested city (3rd in the world) at 166 hours. Paris followed this at 165 hours and London in third place (European ranking), where drivers spent an average of 146 hours in traffic jams. The data revealed that UK drivers lost 115 hours and £894 individually to congestion during 2019. The research shows the UK’s slowest city as a tie between London and Edinburgh, with the average speed of the final mile in both cities at just 10mph.   A positive for European cities is that most boast robust public transport networks and substantial biking and walking routes offering residents appealing alternatives to vehicles. The research illustrates that public transport and cycling are more competitive than driving in the world’s most congested cities.
 

The ten most congested cities:

Do you want to check your country? Try it at INRIX.
Post tags:
  • INRIX Research
  • Global Traffic Scorecard
  • Congested cities
  • Traffic jams
  • 2019 Scorecard

More from the blog

How Bionic Electronics Saved 15% in Operational Costs with Frotcom - Test RM
Flynn RoadFreight Transforms Fleet Management with Frotcom - test
Test blog post - ST - Edge - 0711202
teste blog - en
New Frotcom Certified Partner in Bosnia and Herzegovina

Subscribe our newsletter to get the latest news

Subscribe our newsletter

From our knowledge center

Case Study
How Bionic Electronics Saved 15% in Operational Costs with Frotcom - Test RM
Case Study
Flynn RoadFreight Transforms Fleet Management with Frotcom
Case Study
Case study test
Documentation
teste flyer - firefox - ST
Documentation
Test - Electronic logbook - chrome - ST

Share this

Share on Facebook
Share on Twitter
Share on LinkedIn
Share by Email
Product
    • Features
    • Fleet Activities
    • Customize Your Solution
    • Solutions
    • Integrations
    • Knowledge Center
    • FAQS
    • Help Center
    • Free Version
    • Savings Calculator
Company
    • Frotcom worldwide
    • About us
    • Become a partner
    • Careers
    • Events
    • Blog
The latest in our blog
1 Apr 2025
Driver Safety: Mitigating Risk with Fleet Management Software
18 Feb 2025
How Bionic Electronics Saved 15% in Operational Costs with Frotcom - Test RM
17 Feb 2025
The Role of Telematics in Fleet Sustainability - test RM
Contact us

Email field is invalid

* Mandatory fields.

Read the latest on your email
Subscribe our newsletter
Follow us
  • Facebook
  • Twitter
  • Linkedin
  • Instragram
  • Youtube
  • Pinterest
Awards & recognitions
    • Gold Microsoft Partner
    • PME Líder 2021
    • PME Excelência 2019
    • IT Mark
    • ISO
    • inovadoracotec
  • © 2025 Frotcom International
  • Terms and Conditions
  • About Cookies
  • Quality Policy
  • Privacy Policy
  • About Data Protection
Choose your language
  • Български
  • Deutsch
  • English
  • Español
  • Ελληνικά
  • Français
  • Italiano
  • Македонски
  • Nederlands
  • Português
  • Română
  • Shqip
  • Slovenščina
  • Srpski
  • Svenska