ŽELIM DA ME POKLICETE

* Obvezna polja.

Email field is invalid

  • Login
  • Demo
  • Pišite nam
    • Funkcije
    • Aktivnosti flote
    • Prilagodite svojo rešitev
    • Podjetje
  • Podjetje
    • Podjetje
    • Frotcom po svetu
    • O nas
    • Postanite partner
    • Zaposlitev
    • Blog
    • Postanite partner
    • Zaposlitev
    • Frotcom po svetu
    • Center znanja
    • Help Center
Slovenščina
Meni Meni
  • Login
Slovenščina
išči
    • Blog
    • Postanite partner
    • Zaposlitev
    • Frotcom po svetu
    • Center znanja
    • Help Center
Frotcom Intelligent Fleets Frotcom Intelligent Fleets
Pišite nam
PREIZLUSI DEMO
    • Funkcije
    • Aktivnosti flote
    • Prilagodite svojo rešitev
    • Podjetje
    • Sledenje vozil in spremljanje senzorjev
    • Analiza vedenja med vožnjo
    • Spremljanje voznih časov
    • Upravljanje delovne sile
    • Oddaljen prenos podatkov iz tahografa
    • Nadzor nad dostopom
    • Upravljanje porabe goriva
    • Načrtovanje in spremljanje poti
    • Samodejno prepoznavanje voznika
    • Odkrijte vse funkcije
    • Kako bomo rešili vse potrebe dejavnosti flote
    • Izračun prihrankov
Blog

INRIX Research 2019 Global Traffic Scorecard reveals the world’s most congested cities

Tor, 19/05/2020 - 10:11
Novice in dogodki

Traffic data and analytics specialist INRIX Research released it’s 2019 Global Traffic Scorecard, detailing annual rankings of the most congested cities across the world.

INRIX Research 2019 Global Traffic Scorecard reveals the world’s most congested cities
Traffic data and analytics specialist INRIX Research released it’s 2019 Global Traffic Scorecard in March 2020. The Scorecard details annual rankings of the most congested cities across the world and an analysis of congestion and mobility trends for more than 900 cities across 43 countries worldwide and seven continents worldwide.

The Scorecard is the most in-depth congestion and mobility study of its kind, drawing upon three years of mobility data analysis within the world’s most congested cities and valuable mobility insights across transport modes and between cities.

New to the 2019 Scorecard, INRIX Research calculated trip times for both biking and public transport for the same routes from which vehicle delay is calculated. These calculations were used to determine the feasibility of driving alternatives for the most heavily trafficked commuting corridors in each city of study, providing travel time comparisons, and incident congestion impacts. Combined with drive-time maps and last-mile speeds, these advanced metrics provide a unique basis for cross-national commuting comparisons and analysis.
 

Findings

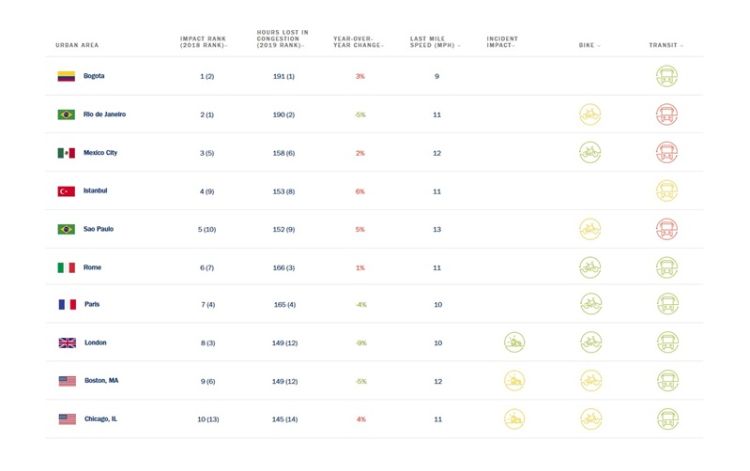
The American continent was shown to account for 11 of the most congested cities in the top 20. When ranking by hours lost in congestion, four of the top-10 cities are located in South America, three in Europe, and two in North America. Bogota (Colombia) was named the most congested city in the world, closely followed by Rio de Janeiro (Brazil), with drivers losing 191 hours and 190 hours, respectively per year in congestion.

In Europe, seven cities featured in the top-20 with Rome topping the chart as the most congested city (3rd in the world) at 166 hours. Paris followed this at 165 hours and London in third place (European ranking), where drivers spent an average of 146 hours in traffic jams. The data revealed that UK drivers lost 115 hours and £894 individually to congestion during 2019. The research shows the UK’s slowest city as a tie between London and Edinburgh, with the average speed of the final mile in both cities at just 10mph.   A positive for European cities is that most boast robust public transport networks and substantial biking and walking routes offering residents appealing alternatives to vehicles. The research illustrates that public transport and cycling are more competitive than driving in the world’s most congested cities.
 

The ten most congested cities:

Do you want to check your country? Try it at INRIX.
Post tags:
  • INRIX Research
  • Global Traffic Scorecard
  • Congested cities
  • Traffic jams
  • 2019 Scorecard

Več z bloga

How Bionic Electronics Saved 15% in Operational Costs with Frotcom - Test RM
Flynn RoadFreight Transforms Fleet Management with Frotcom - test
Test blog post - ST - Edge - 0711202
teste blog - en
New Frotcom Certified Partner in Bosnia and Herzegovina

Naročite se in prejemajte najnovejše novice

Naročite se na naše novice

Iz našega centra znanja

Documentation
Sledenje vozil in spremljanje senzorjev
Documentation
Integracija v VDO Fleet
Documentation
Driver App
Documentation
Napredna nadzorna plošča
Documentation
Upravljanje stroškov

Delite

Share on Facebook
Share on Twitter
Share on LinkedIn
Share by Email
Produkt
    • Funkcije
    • Aktivnosti flote
    • Prilagodite svojo rešitev
    • Rešitve
    • Integrations
    • Center znanja
    • FAQS
    • Help Center
    • Brezplačna različica
    • Izračun prihrankov
Podjetje
    • Frotcom po svetu
    • O nas
    • Postanite partner
    • Zaposlitev
    • Dogodke
    • Blog
Zadnje novice bloga
1 Apr 2025
Driver Safety: Mitigating Risk with Fleet Management Software
18 Feb 2025
How Bionic Electronics Saved 15% in Operational Costs with Frotcom - Test RM
17 Feb 2025
The Role of Telematics in Fleet Sustainability - test RM
Pišite nam

Email field is invalid

* Obvezna polja.

Prebereite zadnje novice na vašem mailu
Naročite se na naše novice
Sledite nam
  • Facebook
  • Twitter
  • Linkedin
  • Instragram
  • Youtube
  • Pinterest
Nagrade in priznanja
    • Gold Microsoft Partner
    • PME Líder 2021
    • PME Excelência 2019
    • IT Mark
    • ISO
    • inovadoracotec
  • © 2025 Frotcom International
  • Pogoji
  • About Cookies
  • Quality Policy
  • Pravilnik o Zasebnosti
  • O Varstvu Podatkov
Choose your language
  • Български
  • Deutsch
  • English
  • Español
  • Ελληνικά
  • Français
  • Italiano
  • Македонски
  • Nederlands
  • Português
  • Română
  • Shqip
  • Slovenščina
  • Srpski
  • Svenska